Historische Hintergründe
Ein wesentlicher Aspekt bei der Berechnung des SCR (Solvency Capital Requirement) unter Solvency II ist die Annahme, dass eine nicht-vollständige Korrelation der einzelnen Risikopositionen einen Diversifikationseffekt nach sich zieht. Hierzu einige Zitate aus der Literatur:
“Although it is an old idea, the measurement and allocation of diversification in portfolios of asset and / or liability risks is a difficult problem, which has so far found many answers. The diversification effect of a portfolio of risks is the difference between the sum of the risk measures of stand-alone risks in the portfolio and the risk measure of all risks in the portfolio taken together, which is typically non-negative, at least for positive dependent risks.”
[Hürlimann (2009), p. 325]
“Diversification arises when different activities complement each other, in the field of both return and risk. […] The diversification effect is calculated by using correlation factors. Correlations are statistical measures assessing the extend to which events could occur simultaneously. […] A correlation factor of 1 implies that certain events will always occur simultaneously. Hence, there is no diversification effect and two risks identically add up. Risk managers tend to say that such risks are perfectly correlated (i.e., they have a high correlation factor), meaning that these two risks do not actually diversify at all. A correlation factor of 0 implies that diversification effects are present and a certain diversification benefit holds.”
[Doff (2007), p. 167f.] “By diversifiable we mean that if a risk category can be subdivided into risk classes and the risk charge of the total risk is not higher than the sum of the risk charges of each subrisk, then we have the effect of diversification. […] This effect can be measured as the difference between the sum of several capital charges and the total capital charge when dependency between them is taken into account.”
[Sandström (2006), p. 188]
“In order to promote good risk management and align regulatory capital requirements with industry practices, the Solvency Capital Requirement should be determined as the economic capital to be held by insurance and reinsurance undertakings in order to ensure that ruin occurs no more often than once in every 200 cases. […] That economic capital should be calculated on the basis of the true risk profile of those undertakings, taking account of the impact of possible risk-mitigation techniques, as well as diversification effects. […] ‘Diversification effects’ means the reduction in the risk exposure of insurance and reinsurance undertakings and groups related to the diversification of their business, resulting from the fact that the adverse outcome from one risk can be offset by a more favourable outcome from another risk, where those risks are not fully correlated. The Basic Solvency Capital Requirement shall comprise individual risk modules, which are aggregated […] The correlation coefficients for the aggregation of the risk modules […], shall result in an overall Solvency Capital Requirement […] Where appropriate, diversification effects shall be taken into account in the design of each risk module.”
[Directive 2009/138/EC, (64) p. 7; (37) p. 24; Article 104, p. 52]
Problematik
Die den Zitaten zu Grunde liegende “naïve” Vorstellung über einen immanenten Zusammenhang zwischen Korrelation und Diversifikation ist mathematisch jedoch letzlich nicht begründbar, wie schon das folgende elementare Beispiel zeigt:
Die gemeinsame Verteilung und die Randverteilungen der Risiken X und Y seien durch folgende Tabelle gegeben, wobei das Risikoniveau α = 0.005 gemäß dem Solvency II-Standard gewählt sei:
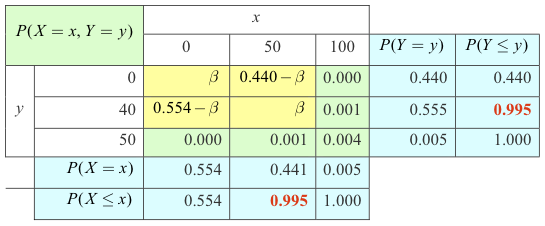
mit einem Parameter 0 ≤ β ≤ 0.440. Die zugehörigen Risikomaße ergeben sich — unabhängig von β — zu VaRα(X) = 50, VaRα(Y) = 40. Für die Momente von X und Y erhält man:
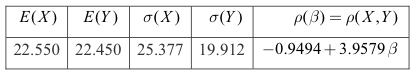
wobei σ wie üblich die Standardabweichung und ρ die Korrelation bezeichnet. Der Bereich aller möglichen Korrelationen in diesem Modell ist gegeben durch das Intervall [ –0.9494; 0.7921 ], wobei eine Korrelation von Null erreicht wird für β = 0.2399.
Die folgende Tabelle gibt die Verteilung des Summenrisikos S = X + Y wieder:
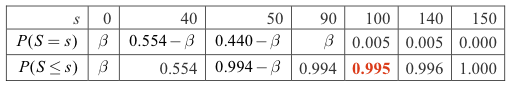
Wie man deutlich sieht, erhält man hier wegen VaRα(S) = 100 > 90 = VaRα(X) + VaRα(Y) einen Risiko-Konzentrationseffekt, und zwar völlig unabhängig von der Wahl des Parameters β und somit auch unabhängig von der Korrelation zwischen X und Y.
Schlussfolgerungen
Eine genauere mathematische Analyse [Pfeifer (2013)] zeigt, dass diese konzeptionelle Unabhängigkeit zwischen Korrelation und Diversifikation unter dem Risikomaß Value at Risk eher symptomatisch und nicht die Ausnahme ist. Der in dem obigen Beispiel angedeutete Effekt stellt sich nämlich z.B. immer dann ein, wenn zwar im Zentralbereich der gemeinsamen Verteilung eine (beliebige) Korrelation vorliegt, aber die Wahrscheinlichkeit für das gemeinsame Eintreten sehr großer Werte in der Größenordnung von α liegt. Hierzu muss nicht einmal eine positive Tail-Abhängigkeit zwischen den Risiken gegeben sein
Diese Beobachtungen sind insbesondere auch unabhängig von den konkreten Randverteilungen der Risiken. Sie treffen u.a. auch schon dann zu, wenn die individuellen Risiken zwar normalverteilt sind, aber die gemeinsame Verteilung keiner Gauß-Copula folgt (d.h. keine echte mehrdimensionale Normalverteilung vorliegt).
Dies zeigt noch einmal deutlich, dass viele konzeptionelle Grundlagen von Solvency II in Bezug auf die Eigenmittelanforderungen sehr stark in der Welt der multivariaten Normalverteilung wurzeln, die nicht ohne weiteres auf andere Risikomodelle übertragbar sind.
Literatur
Doff, R. (2011). Risk Management for Insurers. Risk Control, Economic Capital and Solvency II. 2nd Ed., Risk Books, London.
Hürlimann, W. (2009). Optimisation of the Non-life Insurance Risk Diversification in Solvency II. In: Cruz., M. (ed.) (2009). The Solvency II Handbook. Developing ERM Frameworks in Insurance and Reinsurance Companies, Chapter 12, pp. 325 - 347, Risk Books, London.
Official Journal of the European Union (2009), Vol. 52, L 335: DIRECTIVE 2009/138/EC OF THE EUROPEAN PARLIAMENT AND OF THE COUNCIL of 25 November 2009 on the taking up and pursuit of the business of Insurance and Reinsurance (Solvency II)
Pfeifer, D. (2013). Correlation, tail dependence and diversification. In: Becker, C., Fried,. R. and Kuhnt,.S. (Eds.): Robustness and Complex Data Structures. Springer, Berlin, pp. 301 - 314.
Sandström, A. (2006). Solvency. Models, Assessment and Regulation. Chapman and Hall/CRC, Boca Raton.